

I’ve just been reading through the Welsh Government Report of the Independent Review in Neonatal Services at Prince Charles Hospital in Cwm Taf Morgannwg University Health Board. Much of it was sadly familiar, as I wrote an internal review of women and child health services in that region about 15 years ago. A few things were very familiar: in particular the perpetual challenge of maintaining internal staffing levels; and the big knotty issues of the external collaborative infrastructure, that every child health service now requires to be sustainable.
Another very familiar aspect, was the obvious commitment to improvement by successive teams of managers and practitioners, that have picked up that slippery baton over the intervening years. I know many of them personally, having once managed the same services at the other end of the patch.
It’s been my privilege over the years, to work with dozens of bloody brilliant teams all across the NHS and the Report reminded me of one of the worst and best times I’ve had as a manager. So I thought I’d retell the story of how a little Neonatal Unit developed a risk management and communication tool that took patient safety to a whole other level.
Just offering a little motivation and some proof, that amazing things are possible with a few committed people and a couple of good ideas.
Ahead of STEAM…
Sitting down in a quiet room with a family who have just lost a child, is a familiar and uneasy feeling, quickly recalled by anyone who works in Child Health. Fortunately, it is a reasonably rare event. Now think about that same situation, but one where you have to explain to the little one’s family how, in those last few hours, the care provided was simply not good enough.
I was the Directorate Manager and Karen Healey, the Head of Children’s Nursing, who was adamant that she never wanted people to be in that situation ever again, “something has got to change”. Before you can understand any change, you need to learn about the context within which the change was made. This reflection explains not just what we did, but where we started and how an entire clinical team adopted a very simple idea and then did something amazing.
The Princess of Wales Hospital in Bridgend was at the time, part of Bro Morgannwg NHS Trust and included a typical Child Health Service within a district general hospital. There was one Paediatric Medical Team, a couple of nursing teams and a handful of specialists, covering several separate points of access across the hospital and all the usual swings and roundabouts in between.
In December 2003, we had one of those shifts that started with: “a fitting baby up on Neonates; a flat 1 year old down in A&E; 30-week twins about to drop in maternity; disruptive parents in the assessment unit; and a set of poor blood results on the children’s ward.”
What would you do first? With the magic of hindsight, it’s easy to prioritise the care and direct the resources to get the best outcomes. But how would you do that sort of objective assessment of the care in five different places, under pressure and in real time, without a crystal ball?
Different practitioners come with different experience and clinical, managerial and observational skills. Different staff then react to those observations, influence in different ways and communication quality, method and language changes with and in between different staff and staff groups.
Some people are risk takers; they allow situations to go further before intervening, changing normal routines and altering their behaviour. Other people are nervous; they jump too early and escalate situations before a change in routine is necessary. And most of us are somewhere in the middle, trying our best to balance out a little bit of both.
The child with the poor blood results, died!
Full STEAM ahead…
Following the post-mortem, it became clear that there was very little chance of any clinical intervention being successful no matter how prompt, but the staff involved were devastated and many of them still think about that family. This sentinel event led to the first root cause analysis undertaken by the Trust. Alongside the investigative process, clinicians were provided with professional and personal support for the inevitable collective lesson about how difficult it can be, to prioritise and communicate effectively.
“What we need is some sort of clinical assessment system to escalate and monitor activity, to try and predict problems, put contingencies in place; keep it safe”.
That relatively simple sentence was the brief which led to the development of a system to escalate and monitor: STEAM. We had an idea for a multi purpose tool that would measure clinical capacity in real time. A retrospective audit wouldn’t be good enough, so we needed a live clinical pilot, somewhere familiar with changes in dependency and demand and somewhere that is difficult to explain the workload in traditional ways. The obvious choice was our Neonatal Unit.
Head counting, or simply calculating occupancy rates was the approved measurement of activity, but this didn’t reflect the intensity of care being provided. It’s a common misconception that capacity is about size or space, the number of beds, but in a clinical sense, capacity is the ability to perform work. Capacity is a complex calculation with a number of variables including the dependency, urgency, probability, the expertise available and yes, the physical extent of the facilities.
The project started with a simple principle. Due to the empirical nature of clinical activity, there are endless possible scenarios that can influence the safe and effective provision of care and no set of rules can ever outweigh, the combined experience of the senior clinical team right there, right then. Therefore, the procedure was designed to uphold the principles of good risk management and just became the formal record of that assessment and the subsequent decisions.
STEAM became a tool that enabled staff to record the level of dependency of care being provided to each patient within a department. That measurement then formed the basis for a risk assessment of the clinical capacity of the department, at the time of the assessment.

The principal proforma (a preprinted A3 booklet) had a risk assessment matrix on the front and a series of tables inside, designed as a map of the department, so that every bed, bay and patient can be identified. These tables create a series of Individual Patient Assessment (IPA) that are aggregated to form the basis of an overall assessment of the clinical status. IPA tables like that above, were completely flexible and each department that implemented STEAM designed their own minimum dataset. A supplementary proforma was also developed with just the matrix so that staff could quickly re-assess just the clinical status. The IPAs could be simply and neatly updated and all filed together, as STEAM was adopted as an official medical record.
A decision not to change, or to reduce status was equally relevant and was recorded in the same detail as an assessment to escalate the status. A principal assessment could be undertaken at any time and as often as it was considered necessary, but completed at least once a day at a scheduled handover. The clinical status was then communicated using a simple Traffic Light and a few Keywords.
Sounds daft but the clinical status – colour of the traffic light – was also displayed on large coloured cards opposite the door, so all staff entering the department were immediately aware of the status. Probably the most useful innovation!
The STEAM Gauge…
To undertake the IPAs, every patient was identified and scored to provide a record of the clinical intensity of care being provided at the time of the assessment. The clinical score was based on a level of care from 1 (low intensity) to 5 (high intensity). A departmental procedure was developed with detailed clinical criteria for classification of the casemix based on published guidance, but the scores were fixed:
- Denotes cases of minimal clinical care; unscheduled observations; with any personal care, education or support usually only provided upon request eg self-caring patient or awaiting routine discharge.
- Denotes cases of routine clinical care; scheduled observations; routine medication; with some personal care and support eg recuperative or respite care (maximum status for outlier).
- Denotes cases of complex (including specialist) clinical care; regular observations; prescribed medication; with personal care, education and support eg non-invasive treatments.
- Denotes cases considered to be high dependency, requiring specialist clinical care, frequent observations; advanced medication; respiratory support; with close physical and personal care eg 12 hour post op.
- Denotes cases considered to be intensive care, requiring a minimum of 1:1 clinical care, continuous observations; complex medication; artificial system support; complete physical and personal care eg ventilated neonate, specialled cases.
This clinical scoring system provided two simple measurements: STEAM The overall clinical intensity, calculated as the sum of individual scores as a percentage of the maximum safe score; TAPS The Average Patient Score, calculated as the sum of individual scores divided by the number of patients.
The department’s maximum score is reviewed and calculated by designating every bed within the department a score from 1 to 5 as above, for a theoretical maximum intensity that can be supported by the department’s established staffing skill mix. Within 6 weeks the data gathered using STEAM could then be used to validate the staffing structure. This demonstrated whether a department’s typical roster was consistent with providing safe care for the actual dependency of patients admitted.

After completing the IPAs, the overall risk assessment on the front page is annotated with: reason for the assessment; staffing status nursing, medical numbers and skill mix; status of allied departments and networked services; and senior clinical instructions and advice.
These factors are not scored as in most cases, they affect the clinical capacity in very subjective ways and therefore are best left to a narrative record of the situation. In this way the scoring system, is kept as simple as possible and relates to the most objective element of the service pressure: the clinical dependency of the patients.
The score, the staffing and professional judgement form a kind of triangulation, to agree the functional condition of the department: open to admissions; internal transfers only; limited internal or closed. The overall status is articulated within a communication protocol to allied departments, relaying a great deal of information with only a few words: “Status red. STEAM 94%. Open Internal”.
This simplicity greatly reduced the risk of both reinterpretation and misinterpretation. The traffic light definitions were not exhaustive or fixed, but a context within which the combination of factors at the time of the assessment, should be considered. The decision to change status was made on the basis of the combination of skill mix, individual patient need, available contingencies and not solely on the rate of STEAM:
Green: Staffing is consistent with normal roster, STEAM is below 60% No unusual contingencies are required to maintain normal and safe services.
Amber: Normal skill mix is compromised, STEAM is above 60% Some contingencies have been put in place but the department continues to function safely.
Red: Normal skill mix is seriously compromised, STEAM is above 80% All contingencies have been put into place and the department may need to be closed to admissions.
Black: This level is rarely used and denotes a major event instigated by the Executive. All organisational resources are made available and several departments function within a state of emergency.
The key factor that made the process consistent was that staff were guided to undertake some very simple contingencies as a routine, prior to changing status. To escalate up to Amber, the following should have already been considered and instigated:
- Complete the individual patient assessment for all cases
- Review medical and nursing staffing roster/skill mix and reschedule staff appropriately where possible
- Identify potential admissions and implications of activity across allied departments
- Assess levels of operational and clinical equipment to ensure availability against increased activity
- Delay or postpone non essential planned activities, meetings and appointments
- Contact Nursing Bank or Agency, to enquire on availability of staff
Prior to changing status up to Red, the following should have already been considered and instigated:
- All of the above, a to f, reviewed and reconsidered
- Assess status of allied departments and where appropriate those within the clinical network
- Contact the on-call Senior Nurse and Consultant for advice or attendance
- Secure additional bank, agency or locum staff
These may appear too simple, things that you would have expected management to do anyway. But in practice, staff at all levels were empowered by the process to ask these questions of everyone. A surprising result was that people become more flexible, more willing and able to change plans, simply because they understood why these contingencies were being considered.
Key elements of the escalation still required senior authority, but when those situations arose authority became more about communication than decision making. For example, the decision to close a department to admissions could only be made by the duty Consultant or Head of Nursing and that decision formed part of existing Closure Protocols instigated and communicated to all stakeholders. In line with the first principle of the system, the rate of STEAM did not automatically constitute or discount the closure of the department.
Letting off STEAM…

Following a couple of awareness sessions for staff, STEAM was introduced on to the Neonatal Unit in September 2004 as a pilot for 6 weeks. The success was such that staff continued to use the tool as normal practice and we analysed the first 18 months of activity. Chart 1 demonstrates the Total Clinical Score from the IPAs versus the number of patients. The score varies more widely than the number of cases demonstrating changes in dependency.
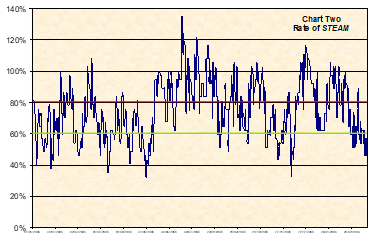
Chart 2 shows the rate of STEAM, demonstrating the range in clinical capacity from 35% on a quiet day to 135% on a day when extra beds had to be opened. The STEAM rate did not automatically constitute a particular traffic light colour, but the chart shows the range of each band. The focus is concentrated around the amber area, firstly because the BAPM guidelines at the time suggested 70% as a reasonable average, but also because that’s where the operational management is most crucial.
The Neonatal Unit was at the time, embroiled in a commissioning battle about what level of service was being paid for. The ideal of 2 intensive care, 3 high dependency and 5 special care babies, rarely occurred that neatly. Using the STEAM, these 10 cots gave us a maximum clinical score for the department of 37. It is clear that the department functioned at or above 100% of the safe capacity on a number of occasions, requiring a great deal of real time management and additional resources.
The method also automatically generated new management information as shown in Chart Three. This is a dependency profile of the Neonatal Unit, showing the numbers of days in a 438 day period, that care was required at each level of dependency. For example it can be seen that on 170 days the unit required 2 HDU cots and on 60 days the unit required 3 HDU cots. This data even quashed a half-arsed national plan intent on replacing our local intensive care capacity with a retrieval cot. We proved it would close the unit and put the entire regional maternity network in escalation, for about 120 days a year. They went away.

We even used the profiling data to compare two very different units and in one case, even an acute orthopaedic ward with a community hospital. This information was then monitored over strategic timescales to identify longer term patterns and validate whether staffing mirrored changes in dependency.
Combine that information with the department’s available budget and you have a workforce analysis and planning tool. At the time: the Neonatal Unit maximum capacity was calculated at 21wte nurses on the shop floor each week; analysis of the actual dependency profile gave a safe minimum of 19wte; and the base roster was managed successfully at 20wte. This excluded leave and sickness, so the establishment was actually higher, but validated that workforce acuity matched demand over time and as such, a safe system of work.
As you’ve probably already worked out, the tool was designed at the outset to be generic. There was nothing within the tools and techniques to make it a neonatal, paediatric or even an orthopaedic clinical tool. The secret lay in its transferability and the flexibility to be tailored to any size, shape or specialty of department.
We implemented STEAM into several other inpatient departments and developed protocols for how the different assessments could collate to provide a picture of the total provision of care. National and international awareness of the system – thanks to winning an NPSA Award – also resulted in a number of other units implementing the tool. Many of whom had it working within a matter of hours, from start to finish, I even helped a couple of places to upload the template into their PAS and the tool could be printed out prepopulated ready for handover.
From the outset the project was organic, timescales were loose and expectations expressed in terms of hope, rather than targets and definitely not in terms of money. The opportunity oriented approach meant that STEAM became far more than was ever envisaged and the team realised benefits in other aspects of delivering high quality care:
- During the introduction the unit dealt with significant increases in demand and complexity and no request for additional staff was refused, yet the first year saw a £35k reduction in agency alone.
- The principal assessment tool was used to formalise handover, as the information collected for the IPA on the department map was exactly what’s needed to facilitate a multidisciplinary handover.
- We did not create any extra work, as the team dumped several other processes for recording what’s happened after the fact as STEAM became an essential part of the process of delivering care.
- The raft of information that is automatically produced enabled the Department to engage with senior colleagues and commissioners to easily demonstrate the reality of managing the service and resource issues, in real time.
But none of this is the “amazing” bit…

Morale improved tremendously with staff feeling more in control, as situations escalated and better supported, being more confident in openly escalating concerns and articulating the assessments and the actions required. Confidence in the team was matched by confidence about the team, “they really know their stuff” was a rare compliment from the Finance Director, as the confidence was backed up with evidence. To truly work in partnership we needed a common language and STEAM enabled everyone from a patient in a bed to a politician 100 miles away, to understand what we were doing and why.
With no grand plan and no extra money, a team of great people in a little Neonatal Unit in South Wales simply created a better place to be, whether you’re a cleaner, a manager, a clinician or an anxious mum… and that’s amazing!
Footnote: I suppose that I should now explain how this work continued to develop over the next 10 years. The innovation not only led to, but methodologically underpinned the first ever national legislation in the world, on safe staffing: The Nurse Staffing Levels (Wales) Act 2016.
